Nicholas Felton
ROUTINE SCREENING

If data is the new oil, Nicholas Felton’s personal life has been one of the most lucrative wells for the last decade: One of the lead designers of Facebook’s timeline and the man responsible for Daytum.com, he’s not only pretty much obsessed with data, charts, and tracking what we do every day and how we do it – but he’s especially dedicated and committed to tracking his own life, his routines, and he’s been weaving the results into an amazing world of graphs, maps, and statistics for almost 10 years now. Having closely monitored his life for his stunning Annual Reports since 2005, he recently launched a new life-logging app called Reporter and is now in the final stages of collecting material for his 2014 Report – the ultimate one, wrapping up a decade in data collecting. Time to talk shop with the one true master of self-surveillance.


Nicholas, what are you up to these days? “Creating” more or less expectable data – or have there been any aberrations or weird developments lately? I’m working on a number of projects at the moment. Predictably, I’m collecting data for the next (and final) Annual Report. The 2014 report will be based on data collected from off-the-shelf devices and apps. My goal is to evaluate how interesting and expansive the data available to anyone has become in the 10 years since I began this project. I’m also continuing work on Reporter, the iPhone app I released earlier this year, and developing a new mobile app with an engineer I met while working at Facebook.
Imagine meeting some fellow like Mr. H.D. Thoreau – how would you explain to him what you’re doing, your mission, your relationship to time/self/technology/progress etc.? I am enchanted by the idea that the patterns of our lives might be rendered vividly if viewed from the right angle. I am recording details of my behavior with the hope that I can discover approaches that will help others see the contours of their lives with clarity. In the past few years, this has become more than an odd hobby as technological advances have made it possible to measure oneself in many ways with astounding resolution. It is my goal to explore the stories and patterns embedded in these traces and to demonstrate their power and value to others.
What kind of data are you currently (most) interested in (and working with)? Location data? Consumption data? Social data? All of them?
At the moment I’m most interested in the data that everyone is creating but not necessarily analyzing. We generate a constant exhaust of location, communication, financial and social data that could be put together in interesting ways but remains isolated or unaccessed because people don’t know that it exists or they don’t know what to do with it.
Do you think you’d be doing what you do if you hadn’t been exposed to that book “Comparisons”?
I think so. I grew up with a healthy scientific interest fostered by National Geographic and frequent trips to San Francisco’s museums. I thought that I might end up a scientist, but the pull of art and design pushed me to where I am today.
You’ve been doing your amazing Annual Reports for almost a decade; what are some of the long-time lessons you’ve learned?
I haven’t tried to compare any of my metrics on a longer timescale than the Annual Report, so it’s tough to provide long-term findings. I intend to delve into this after completing the tenth report and would love to investigate how my music, reading, drinking, exercise and travel habits have changed over the course of the project. I’m hopeful that I’ll be drinking less, exercising and traveling more and spending more time with friends… but I’m not sure the data will support this.
Do you think you’ve done/not done certain things over the years because you were monitoring your behavior so closely? Examples?
I’ve tried to frame the data collection to improve my behavior in ways that I value. In the past this meant saying yes to more opportunities. Nowadays I think that is less of a factor, but I certainly found myself avoiding conversations at certain points last year because I did not want to be troubled to record them.
Was there a moment when you intentionally said “I’m not going to include what happens/happened here” – because it was too blurry/weird/extreme…? I don’t think so. Usually those moments are ones that I intentionally include in the reports… like when the Secret Service knocked on my office door in 2008. Apart from that, I have tried to keep financial and bathroom matters out of my recording.
Tell me about your current data collecting/tracking set-up/routine… what’s the latest? This year is intended to use items that anyone can purchase or implement… here’s what I’m using:
Basis Band: An activity tracking watch that tracks sleep and heart rate.
Nike Fuel Band: An activity tracking bracelet.
Fitbit: A pedometer that lives in my pocket.
Lapka BAM: A breathalyzer that connects to my iPhone.
Moves: A location tracking app.
Withings Scale: A network connected scale.
RescueTime: An app that tracks my computer usage.
Automatic: A device that connects to my car’s diagnostic port and tracks my driving habits.
Nike+ Running: Tracks my running.
Narrative: A persistent camera that takes a photo every 30 seconds (I discontinued using this in March).
The bulk of these are automatic, I just need to keep them charged and synced. The main exception is the breathalyzer which I try to use any time I’ve been drinking.
Six years ago you were the only person among your friends to wear a pedometer… nowadays it’s a different story – yet, how do you think things will look 6 years down the road, in 2020? I think that any number of health signals will be available to those who want them. I expect that implanted sensors will be available by this time. At the very least, these should provide constant monitoring of hydration and glucose levels. Chemical mood tracking may be in the early stages. I hope that this will lead to a point where understanding how your body reacts can lead to tailored diets or medications designed for specific metabolisms.
What are the lessons you learned from doing Daytum – and how did these lessons affect Reporter? I love Daytum and still think that there’s a place for it in people’s lives. The Achilles’ heel of the service is that if there is a break in the data that incompleteness can lead to a mistrust of the data. On the other hand, Reporter embraces incompleteness. Reporter is based on the idea that you cannot capture everything and that it is sufficient (and in some cases superior) to merely record what you’re doing every once in a while.
You’ve stated that you want to do things that haven’t been done before, to fill a need – don’t you think you sometimes create a need as well? I hope so. I don’t have a full understanding of what it is that people like most about my Annual Reports, but I like to think that when it works it acts as a mirror. It’s my hope that when reading the report, a viewer inserts themselves into the story and speculates about whatever question I’m answering, like how many beers they drank last year. If this is the case, then I am creating a desire for people to answer these questions about their own lives that they might not have had before.
How are you going to celebrate 10 years of Annual Reportage? A cold Stella Artois? I expect that it will be more like a cold sweat. At the beginning of every new year, I experience a chill when I forget that I’m not following the previous year’s approach and think that I’m missing something. After 10 years of recording it will be a very odd feeling to be untethered from this routine. Ultimately I would like to produce a book containing all ten reports as well as some process and meta-analysis of the entire data set.
What are the numbers/what kind of data should ideally be included on your tombstone one day? I would be happy for it to merely list the number of children I have.
Is data analysis gonna save us? Analysis is only one side of the coin. I often find myself asking what happens when everything is measured, and the answers are as exciting as they are frightening. It might promise the end of disease or the end of privacy. Ultimately I think that there will be limits to the things that can be measured, but we will also find that legal limits need to be imposed on what should be measured. Privacy legislation already makes it illegal in many states to record a conversation without two-party consent, and it seems likely that gathering someone’s DNA or heartbeat without their permission will take the same route.
Let’s wrap this up: What can you tell me about that Catch-22 project you’ve done back in college? In my last semester in college I read Catch-22 while on an independent study trip through Japan. I loved the book and found many of the items described so concrete that I felt compelled to construct them, but with the Japanese twist of my surroundings. Ultimately, I approached the book as a history of real events that had taken place in the Pacific theater of World War II, but that Joseph Heller transposed to Italy. I produced items described in the novel like Yossarian’s rule-based censored letters, the form condolence letters and identities for Milo’s companies. I also invented items that were inspired by the world of the book. For example, Yossarian was so resigned to being shot at while flying that I decided it would be useless to paint his airplane to match a clear sky. If flak was an inevitability, then his plane should look like puffs of smoke and explosions… so I designed an air and jungle version of this “active camouflage” concept. In addition, I designed maps of circuitous conversations, a typeface and even a short propaganda film for Milo.
Having grown up in Northern Cali, you still happy in Brooklyn? I am very happy in Brooklyn, but appreciate where I grew up more and more… and love that my family gives me reason to return often.
Oh, and your mom used to work for The Beatles? That’s right. She worked for Apple Records in her youth as well as for the producers of the Bond movies.
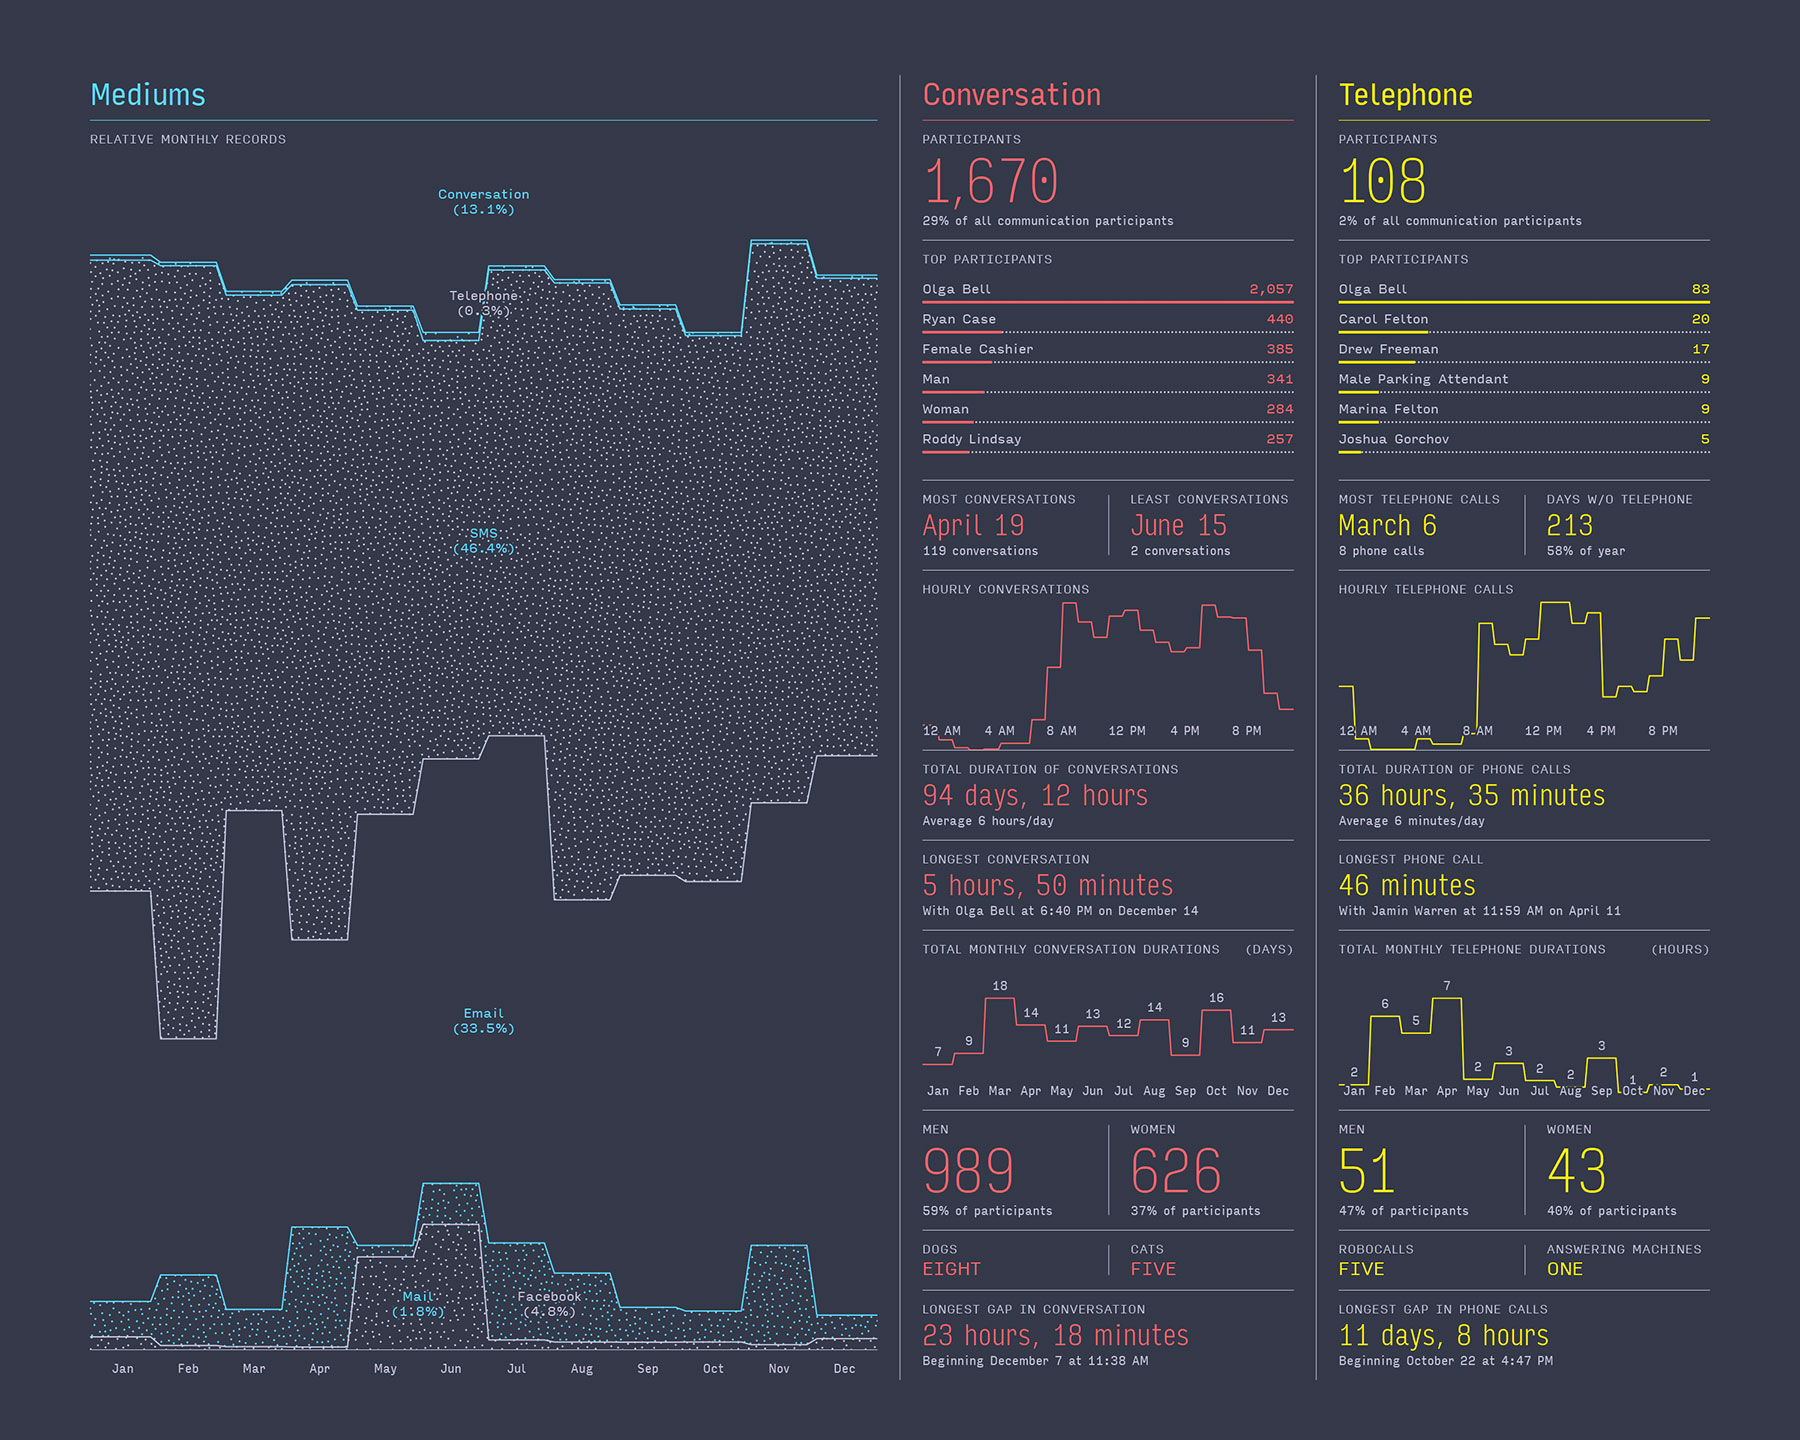
And this one: Since you captured a year of conversation before, does this mean this interview is going to be part of next year’s visual roundup? Unfortunately, I don’t think it will be a part of the next report. Communication was the theme for last year, and I’m not sure that any of my data-gathering schemes for 2014 will capture it.
Words: Renko Heuer
Feltron.com